Making postgresql query 1000 times faster
Abstract
There’s a handy feature in PostgreSQL called row constructor comparisons that allows me to compare tuples of columns. Instead of doing
CreateAt > ?1 OR (CreateAt = ?1 AND Id > ?2), we can do(CreateAt, Id) > (?1, ?2).
Mattermost uses Elasticsearch in large deployments to reduce the stress the database suffers when running search queries while returning even better, fine-tuned results. For this to work, Elasticsearch needs to index all data we want to search for, so that it can retrieve it quickly when requested. Once the data is indexed, all works as expected, our users are happy, our developers are happy, and life is good.
However, I recently tested something I haven’t tried in a while: indexing a fairly large database (with 100 million posts) completely from scratch. When the database is already indexed, subsequent indexes of new posts and files are quite fast, so the normal usage of Elasticsearch is flawless, but an index from scratch is slow:

This screenshot is our job system informing us that the Elasticsearch indexing job has been running for around 18 hours, and hasn’t even finished half of what it needs to do 🙁 And the progress was not linear, slowing down more and more the further it progressed! Something was clearly wrong here.
The culprit
Let’s start the investigation by identifying what exactly is slow here, since there are many moving parts: it could be the database, the Mattermost server, the Elasticsearch server, the network, or an under-resourced machine.
Looking at our Mattermost Performance Monitoring Grafana dashboard while the indexing job was running, the problem was crystal clear at first sight:
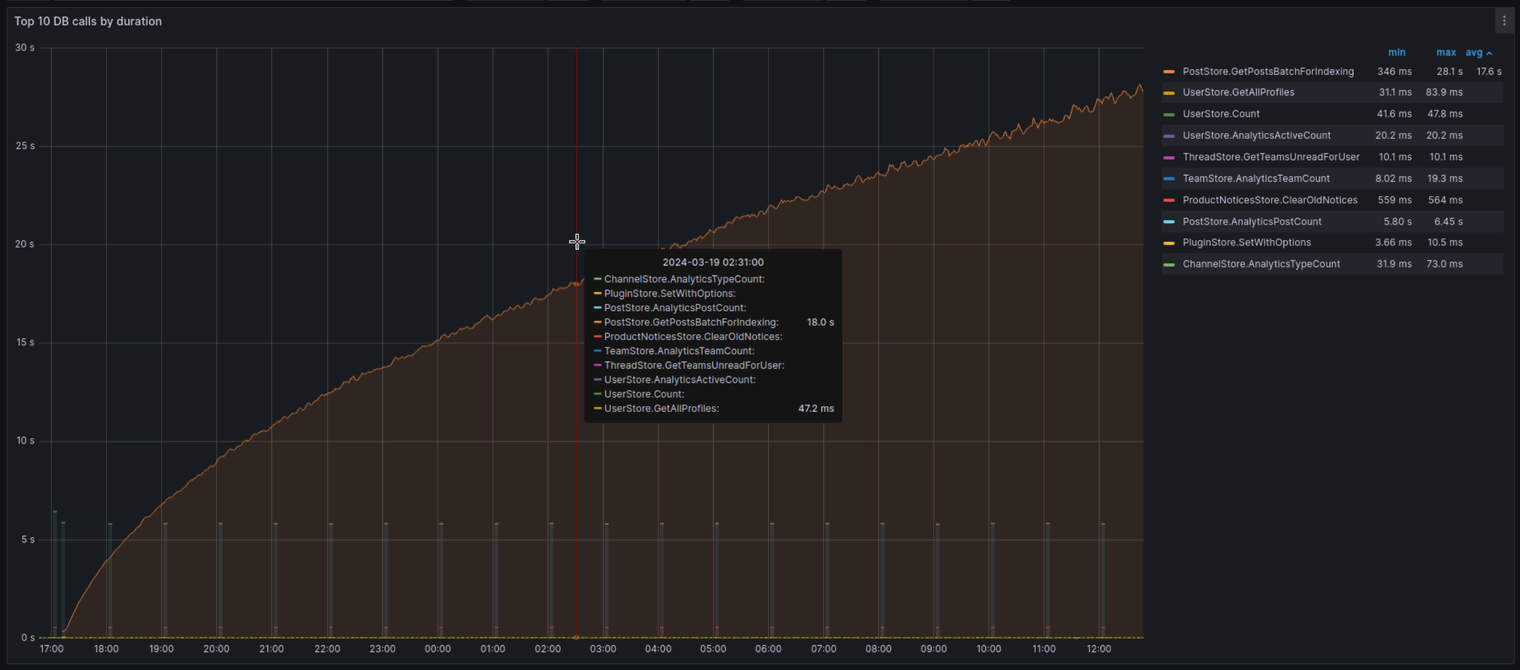
The graph above shows the top 10 database calls by duration, which comes down (simplifying it a bit) to the following Prometheus query:
topk(10,
    sum(increase(mattermost_db_store_time_sum[5m])) by (method)
    /
    sum(increase(mattermost_db_store_time_count[5m])) by (method)
)
We measure the time it takes for each database method to finish, averaged over the last 5 minutes, and we plot that by second, showing only the top 10 methods.
And looking at the graph, there’s a clear outlier there: PostStore.GetPostsBatchForIndexing, which is taking more and more time as the indexing job progresses, eventually hitting the 30 seconds mark, when it simply times out. Looking at the code, we see the exact query that’s causing all these problems:
SELECT Posts.*, Channels.TeamId
  FROM Posts LEFT JOIN Channels ON Posts.ChannelId = Channels.Id
  WHERE
    Posts.CreateAt > ?1
    OR
    (Posts.CreateAt = ?1 AND Posts.Id > ?2)
  ORDER BY Posts.CreateAt ASC, Posts.Id ASC
  LIMIT ?3;
This query does a simple job: it orders all posts by their creation timestamp and returns the first N (a limit provided by the caller) posts that are newer than a provided timestamp. The query needs to check the ID of the post and cover the rare case of two posts happening simultaneously. It also joins with the Channels table, but only to return the post’s TeamId along with its other data.
The indexing job is then built on top of this query, running it over and over again until all posts are indexed. In pseudo-code, it looks something like this:
func IndexingJob() {
    t := 0
    id := ""
    limit := 1000
    for {
        // Run the query
        batch := GetPostsBatchForIndexing(t, id, limit)

        // Index the posts returned by the query
        elasticsearchService.Index(batch)

        // Stop when we get less than `limit` posts
        if len(batch) < limit {
            break
        }

        // Update the timestamp and id to newest post's
        newestPost := batch[len(batch)-1]
        t = newestPost.CreateAt
        id = newestPost.Id
    }
}
The first investigation
Now that we understand what we’re dealing with and what piece of the whole system is misbehaving, we can start the real investigation.
Trying to optimize a SQL query never follows a predefined plan, but one can apply some methodologies that can help find the problem and possibly the solution faster and more consistently. I didn’t do any of that, though, and my investigation was chaotic and instinct-driven at first. Never do this at home.
My first concern with this query was: why on earth does it take longer and longer each time it gets executed? The answer was actually pretty simple, but I had no idea at the beginning. So the first thing I looked at was the data I already had at hand: the AWS Performance insights of the query:
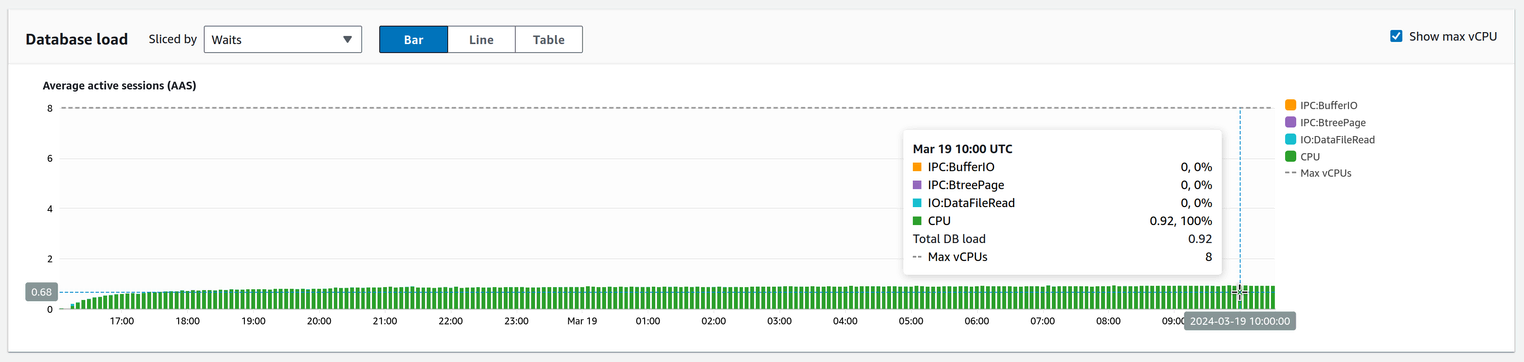
This gave me the first clue: the query spends nearly 100% of its running time on CPU. This means the query is not bottlenecked by the time it takes to read or write data, but by the time it takes to process that data. Interesting.
Then I started playing with the query. The first thing I did was, of course, run an EXPLAIN ANALYZE. Lately, I’ve gotten into the habit of adding the BUFFERS option to this, so the EXPLAIN gives a bit more data. There’s a fantastic blog post on the BUFFERS option, so I won’t go into much detail here, but by copying the definition from pgMustard, which is short and to the point, we can understand what this does:
BUFFERS extends EXPLAIN by adding values to describe the data read/written by each operation.
We’re not only getting info on the query plan, but also on the actual data we move around. Neat.
Now, choosing some data for the arguments the query receives (the timestamp, the post ID and the limit), I ran EXPLAIN (ANALYZE, BUFFERS) and got the following result:
mmdb=> EXPLAIN (ANALYZE, BUFFERS) SELECT Posts.*, Channels.TeamId FROM Posts LEFT JOIN Channels ON Posts.ChannelId = Channels.Id WHERE Posts.CreateAt > '1687424888405' OR (Posts.CreateAt = '1687424888405' AND Posts.Id > 'tpomh9yu1tffmdp6dopobwuc9h') ORDER BY Posts.CreateAt ASC, Posts.Id ASC LIMIT 10000;
QUERY PLAN
------------------------------------------------------------------------------------------------------------------------------------------------------------------------
 Limit  (cost=1.22..2287.94 rows=10000 width=464) (actual time=23921.236..23954.229 rows=10000 loops=1)
   Buffers: shared hit=40557115
   ->  Incremental Sort  (cost=1.22..13998881.93 rows=61217938 width=464) (actual time=23921.235..23953.205 rows=10000 loops=1)
         Sort Key: posts.createat, posts.id
         Presorted Key: posts.createat
         Full-sort Groups: 311  Sort Method: quicksort  Average Memory: 45kB  Peak Memory: 45kB
         Buffers: shared hit=40557115
         ->  Nested Loop Left Join  (cost=1.00..11421751.31 rows=61217938 width=464) (actual time=23920.970..23947.067 rows=10001 loops=1)
               Buffers: shared hit=40557115
               ->  Index Scan using idx_posts_create_at on posts  (cost=0.57..9889434.54 rows=61217938 width=461) (actual time=23920.930..23931.063 rows=10001 loops=1)
                     Filter: ((createat > '1687424888405'::bigint) OR ((createat = '1687424888405'::bigint) AND ((id)::text > 'tpomh9yu1tffmdp6dopobwuc9h'::text)))
                     Rows Removed by Filter: 40920000
                     Buffers: shared hit=40553119
               ->  Memoize  (cost=0.43..0.70 rows=1 width=30) (actual time=0.001..0.001 rows=1 loops=10001)
                     Cache Key: posts.channelid
                     Cache Mode: logical
                     Hits: 9002  Misses: 999  Evictions: 0  Overflows: 0  Memory Usage: 151kB
                     Buffers: shared hit=3996
                     ->  Index Scan using channels_pkey on channels  (cost=0.42..0.69 rows=1 width=30) (actual time=0.007..0.007 rows=1 loops=999)
                           Index Cond: ((id)::text = (posts.channelid)::text)
                           Buffers: shared hit=3996
 Planning:
   Buffers: shared hit=112
 Planning Time: 0.501 ms
 Execution Time: 23954.974 ms
(25 rows)
That’s… a lot to digest. Some key points:
- The second-to-last line, the execution time, says this query took around 24 seconds to finish. This is what we want to fix.
- The query plan shows the nodes. From inner to outer:
- First, a couple of Index scan nodes:
- One on the Posts table, with a Filter applying the WHERE condition, using an index covering the CreateAt field. Why is it not using the other index this table has on (CreateAt, Id), though? We don’t know yet.
- Another on the Channels table, with an Index Cond applying the join condition (the post’s ID equals the channel’s ID), using the the index on the primary key, which is the ID.
- Then, it performs the JOIN itself between the Posts and Channels table.
- Finally, it does an Incremental Sort, using Posts.CreateAt and Posts.Id as the sort keys, noting that we have an already sorted key, Posts.CreateAt, due to the fact that we used the idx_posts_create_at index before.
- First, a couple of Index scan nodes:
- The number of shared hit buffers is forty million on the Index Scan node for the Posts table and on the wrapping Nested Loop Left Join node. That’s a lot.
Point 3 here is important. Although the number of hits inside a nested loop has its nuances, it’s something that gives us another clue: here’s where the CPU is being spent. Even if this doesn’t mean we’re reading 40 million blocks from the cache (we would need a pretty large cache for that), it means we are processing 40 million blocks. We can check how much data this means, actually:
mmdb=> SELECT pg_size_pretty(40557115 * current_setting('block_size')::bigint);
 pg_size_pretty
----------------
 309 GB
(1 row)
So that query is processing three hundred gigabytes. Not bad.
The first solution
The first thing I tried to solve this was to remove the JOIN with the Channels table. Both tables are pretty large, so I was worried this was adding a lot of overhead to the query. That ended up not being the case. The time taken on the query without the JOIN was virtually the same as with it.
What next, then? The next step was mostly luck. I wanted to keep understanding the query, so I kept simplifying it. If the JOIN was not the problem, the only other complexity was in the WHERE condition: CreateAt > t OR (CreateAt = t AND Id > id).
So I ran EXPLAIN with the query skipping the second part of the OR; i.e.:
SELECT Posts.*, Channels.TeamId
  FROM Posts LEFT JOIN Channels ON Posts.ChannelId = Channels.Id
  WHERE Posts.CreateAt > ?1 -- <- only the first condition here
  ORDER BY Posts.CreateAt ASC, Posts.Id ASC
  LIMIT ?3;
And I got a very interesting result:
mmdb=> EXPLAIN (ANALYZE, BUFFERS) SELECT Posts.*, Channels.TeamId FROM Posts LEFT JOIN Channels ON Posts.ChannelId = Channels.Id WHERE Posts.CreateAt > '1687424888405' ORDER BY Posts.CreateAt ASC, Posts.Id ASC LIMIT 10000;
QUERY PLAN
----------------------------------------------------------------------------------------------------------------------------------------------------------------
 Limit  (cost=1.14..1616.83 rows=10000 width=464) (actual time=0.347..33.077 rows=10000 loops=1)
   Buffers: shared hit=13949
   ->  Incremental Sort  (cost=1.14..9890887.64 rows=61217938 width=464) (actual time=0.346..32.054 rows=10000 loops=1)
         Sort Key: posts.createat, posts.id
         Presorted Key: posts.createat
         Full-sort Groups: 311  Sort Method: quicksort  Average Memory: 45kB  Peak Memory: 45kB
         Buffers: shared hit=13949
         ->  Nested Loop Left Join  (cost=1.00..7313757.02 rows=61217938 width=464) (actual time=0.053..25.892 rows=10001 loops=1)
               Buffers: shared hit=13949
               ->  Index Scan using idx_posts_create_at on posts  (cost=0.57..5781440.25 rows=61217938 width=461) (actual time=0.032..9.802 rows=10001 loops=1)
                     Index Cond: (createat > '1687424888405'::bigint)
                     Buffers: shared hit=9953
               ->  Memoize  (cost=0.43..0.70 rows=1 width=30) (actual time=0.001..0.001 rows=1 loops=10001)
                     Cache Key: posts.channelid
                     Cache Mode: logical
                     Hits: 9002  Misses: 999  Evictions: 0  Overflows: 0  Memory Usage: 151kB
                     Buffers: shared hit=3996
                     ->  Index Scan using channels_pkey on channels  (cost=0.42..0.69 rows=1 width=30) (actual time=0.007..0.007 rows=1 loops=999)
                           Index Cond: ((id)::text = (posts.channelid)::text)
                           Buffers: shared hit=3996
 Planning:
   Buffers: shared hit=112
 Planning Time: 0.440 ms
 Execution Time: 33.735 ms
(24 rows)
See that execution time? That’s 30 _milli_seconds, or ~1000 times less than the original query! And the shared hit buffers is at 13949, or a more sane 109 MiB. Before I could keep looking at this plan, I immediately tried to run a query with only the second part of the OR condition; i.e.:
SELECT Posts.*, Channels.TeamId
  FROM Posts LEFT JOIN Channels ON Posts.ChannelId = Channels.Id
  WHERE Posts.CreateAt = ?1 AND Posts.Id > ?2 -- <- only the second condition here
  ORDER BY Posts.CreateAt ASC, Posts.Id ASC
  LIMIT ?3;
Without thinking too much about it, I honestly expected this to take around 24 seconds again, so that I could focus on optimizing only this part. But here’s what I got:
agnivaltdb=> EXPLAIN (ANALYZE, BUFFERS) SELECT Posts.*, Channels.TeamId FROM Posts LEFT JOIN Channels ON Posts.ChannelId = Channels.Id WHERE Posts.CreateAt = '1687424888405' AND Posts.Id > 'tpomh9yu1tffmdp6dopobwuc9h' ORDER BY Posts.CreateAt ASC, Posts.Id ASC LIMIT 10000;
QUERY PLAN
--------------------------------------------------------------------------------------------------------------------------------------------
 Limit  (cost=0.99..17.03 rows=1 width=464) (actual time=0.015..0.015 rows=0 loops=1)
   Buffers: shared hit=4
   ->  Nested Loop Left Join  (cost=0.99..17.03 rows=1 width=464) (actual time=0.014..0.014 rows=0 loops=1)
         Buffers: shared hit=4
         ->  Index Scan using idx_posts_create_at_id on posts  (cost=0.57..8.59 rows=1 width=461) (actual time=0.013..0.013 rows=0 loops=1)
               Index Cond: ((createat = '1687424888405'::bigint) AND ((id)::text > 'tpomh9yu1tffmdp6dopobwuc9h'::text))
               Buffers: shared hit=4
         ->  Index Scan using channels_pkey on channels  (cost=0.42..8.44 rows=1 width=30) (never executed)
               Index Cond: ((id)::text = (posts.channelid)::text)
 Planning:
   Buffers: shared hit=112
 Planning Time: 0.437 ms
 Execution Time: 0.047 ms
(13 rows)
It took 0.047 milliseconds!!!! That’s… well, ~500000 (five hundred thousand) times quicker than the original query. What????
Ah, wait, it returned no rows, that makes sense. And it didn’t return rows because it covers a quite rare case, since we’re looking for a post happening in the same millisecond as another one and whose ID is larger than the given one. Not impossible, but not frequent either.
But the important question was: where did my original 24 seconds go? Why are these two separate queries taking 30 _milli_seconds in total instead of 30 seconds?
I still had too many questions and not enough answers, but I made a decision: I’ll split the original query into those two, run them one after the other, and collect the results in the Mattermost server code afterwards. It will make the code a bit more complex, but it’ll be worth it. I’ll do that tomorrow morning, I said to myself.
Actually understanding everything
I didn’t do that the next morning either, of course, and I instead went back to understand what was happening. Why were we getting so many shared hit buffers in the original query? Why was it taking longer each time it got executed? Why did the split queries return the exact same answer but 1000 times faster?
Well, I already had all data I needed to understand everything; it’s just that I hadn’t paid the attention it deserved.
Looking back at the query plans of the original query and the one filtering only by CreateAt > ..., we see a very important difference. Let’s look a bit closer to the Index Scan node in both cases.
First, the original query:
->  Index Scan using idx_posts_create_at on posts  (cost=0.57..9889434.54 rows=61217938 width=461) (actual time=23920.930..23931.063 rows=10001 loops=1)
        Filter: ((createat > '1687424888405'::bigint) OR ((createat = '1687424888405'::bigint) AND ((id)::text > 'tpomh9yu1tffmdp6dopobwuc9h'::text)))
        Rows Removed by Filter: 40920000
        Buffers: shared hit=40553119
Now, the one filtering only by CreateAt > ...:
->  Index Scan using idx_posts_create_at on posts  (cost=0.57..5781440.25 rows=61217938 width=461) (actual time=0.032..9.802 rows=10001 loops=1)
        Index Cond: (createat > '1687424888405'::bigint)
        Buffers: shared hit=9953
Did you spot the difference? The first one uses a Filter, removing 40 million rows in the process, while the second one uses an Index Cond, just checking the index itself.
And that’s the main difference. Going back to the short and to-the-point descriptions of pgMustard:
Index Cond is the condition used to find the locations of rows from the index. Postgres uses the structured nature of the index to quickly jump to the rows it’s looking for.
Although similar in purpose to “Filter”, the implementation is completely different. In a “Filter”, rows are retrieved and then discarded based on their values. As such, you can find an “Index Cond” and a “Filter” on the same operation.
So that’s the key difference: the original query is going through all the rows in the Posts table, then discarding or keeping them based on the condition, while the second one just looks at the index and retrieves the rows it needs. One question answered!
But this also explains why the query takes longer and longer each time it gets executed: as it orders the posts from oldest to newest, and each query uses the newest timestamp of the last batch, it needs to discard more and more rows each time. To see this more clearly, let’s say our Posts table has 1000 posts, and we index batches of 100 posts each time. Then the job runs as follows:
- The first batch will return posts 0 to 99, discarding no posts at all, so it will be quite fast. In total, it has processed 100 posts, as one could expect.
- The second batch will return posts 100 to 199, but only after having discarded the first 100 posts. Those first 100 posts were read, though, so in total, it has processed 200 posts.
- The third batch will return posts 200 to 299, discarding the first 200 posts. That’s 300 posts processed in total.
- …
- …
- …
- The tenth and last batch will return posts 900 to 999, discarding the first 900 posts. This last batch processed 1000 posts, that is, the whole table.
My other two questions have been answered as well: the original query had so many shared hit buffers and was taking longer and longer simply because it was eventually going through the one hundred million posts in our database. Poor query.
The beautiful solution
Although it’s true that we now understand everything, we are still left with the original task: split the original query in two, run them independently, and collect the results afterwards in the server.
But there’s an alternative, though! Now that I understand everything, I was able to look for similar cases with the exact incantation needed to summon the gods of StackOverflow. And they delivered. Thank you, StackOverflow. And thank you, Laurenz Albe.
It turns out there’s a handy feature in PostgreSQL called row constructor comparisons that allows me to compare tuples of columns. That’s exactly what we need. Instead of doing CreateAt > ?1 OR (CreateAt = ?1 AND Id > ?2), we can do (CreateAt, Id) > (?1, ?2). And the row constructor comparisons are lexicographical, meaning that it’s semantically the same as what we had before!
So we just need to convert our original query to the following:
SELECT Posts.*, Channels.TeamId
  FROM Posts LEFT JOIN Channels ON Posts.ChannelId = Channels.Id
  WHERE (Posts.CreateAt, Posts.Id) > (?1, ?2) -- <- lexicographical comparisons to the rescue!
  ORDER BY Posts.CreateAt ASC, Posts.Id ASC
  LIMIT ?3;
And what’s the result? Well, let’s see:
mmdb=> EXPLAIN (ANALYZE, BUFFERS) SELECT Posts.*, Channels.TeamId FROM Posts LEFT JOIN Channels ON Posts.ChannelId = Channels.Id WHERE (Posts.CreateAt, Posts.Id) > ('1687424888405', 'tpomh9yu1tffmdp6dopobwuc9h') ORDER BY Posts.CreateAt ASC, Posts.Id ASC LIMIT 10000;
                                                                           QUERY PLAN
-----------------------------------------------------------------------------------------------------------------------------------------------------------------
 Limit  (cost=1.15..1666.83 rows=10000 width=464) (actual time=0.366..34.053 rows=10000 loops=1)
   Buffers: shared hit=13951
   ->  Incremental Sort  (cost=1.15..10196977.36 rows=61217938 width=464) (actual time=0.365..33.031 rows=10000 loops=1)
         Sort Key: posts.createat, posts.id
         Presorted Key: posts.createat
         Full-sort Groups: 311  Sort Method: quicksort  Average Memory: 45kB  Peak Memory: 45kB
         Buffers: shared hit=13951
         ->  Nested Loop Left Join  (cost=1.00..7619846.74 rows=61217938 width=464) (actual time=0.059..26.840 rows=10001 loops=1)
               Buffers: shared hit=13951
               ->  Index Scan using idx_posts_create_at on posts  (cost=0.57..6087529.97 rows=61217938 width=461) (actual time=0.040..10.548 rows=10001 loops=1)
                     Index Cond: (createat >= '1687424888405'::bigint)
                     Filter: (ROW(createat, (id)::text) > ROW('1687424888405'::bigint, 'tpomh9yu1tffmdp6dopobwuc9h'::text))
                     Rows Removed by Filter: 2
                     Buffers: shared hit=9955
               ->  Memoize  (cost=0.43..0.70 rows=1 width=30) (actual time=0.001..0.001 rows=1 loops=10001)
                     Cache Key: posts.channelid
                     Cache Mode: logical
                     Hits: 9002  Misses: 999  Evictions: 0  Overflows: 0  Memory Usage: 151kB
                     Buffers: shared hit=3996
                     ->  Index Scan using channels_pkey on channels  (cost=0.42..0.69 rows=1 width=30) (actual time=0.007..0.007 rows=1 loops=999)
                           Index Cond: ((id)::text = (posts.channelid)::text)
                           Buffers: shared hit=3996
 Planning:
   Buffers: shared hit=112
 Planning Time: 0.471 ms
 Execution Time: 34.716 ms
(26 rows)
34 milliseconds, yay! A query that’s 1000 times faster, and that’s even more readable than the original one, a textbook win-win.
If you take a look at the Index Scan node, you’ll notice that PostgreSQL is now using an Index Cond, thus checking the index to find those posts, and only afterwards applying a Filter. The shared hit buffers went down to 9955, which is only 78 MiB. Isn’t it beautiful?
(Why the query planner doesn’t automatically convert a condition like x > a OR (x == a AND y > b) to (x, y) > (a, b) is something I still don’t understand to this day, though.)
The solution we need
So I was done. But then I remembered that we not only support PostgreSQL, but also MySQL. And that made me shiver.
Of course, the behaviour in MySQL was the complete opposite 🙁
Let’s run an EXPLAIN ANALYZE (no BUFFERS in MySQL, sorry) on the query running in MySQL. First, the original one:
mysql> EXPLAIN ANALYZE SELECT Posts.*, Channels.TeamId FROM Posts USE INDEX(idx_posts_create_at_id) LEFT JOIN Channels ON Posts.ChannelId = Channels.Id WHERE Posts.CreateAt > 1557752415221 OR (Posts.CreateAt = 1557752415221 AND Posts.Id > 'ad59ire57tfwmjr5r8xqxc75qw') ORDER BY Posts.CreateAt ASC, Posts.Id ASC LIMIT 10000;
+---------------------------------------------------------------------------------------------------------------------------------------------------------------------------------------------------------------------------------------------------------------------------------------------------------------------------------------------------------------------------------------------------------------------------------------------------------------------------------------------------------------------------------------------------------------------------------------------------------------------------------------------------------------------------------------------------------------------------------------------------------------------------+
| -> Limit: 10000 row(s)  (cost=7472068.91 rows=10000) (actual time=0.063..164.174 rows=10000 loops=1)
    -> Nested loop left join  (cost=7472068.91 rows=5559093) (actual time=0.062..163.450 rows=10000 loops=1)
        -> Index range scan on Posts using idx_posts_create_at_id over (CreateAt = 1557752415221 AND 'ad59ire57tfwmjr5r8xqxc75qw' < Id) OR (1557752415221 < CreateAt), with index condition: ((Posts.CreateAt > 1557752415221) or ((Posts.CreateAt = 1557752415221) and (Posts.Id > 'ad59ire57tfwmjr5r8xqxc75qw')))  (cost=1357066.29 rows=5559093) (actual time=0.043..97.358 rows=10000 loops=1)
        -> Single-row index lookup on Channels using PRIMARY (Id=Posts.ChannelId)  (cost=1.00 rows=1) (actual time=0.006..0.006 rows=1 loops=10000)
 |
+---------------------------------------------------------------------------------------------------------------------------------------------------------------------------------------------------------------------------------------------------------------------------------------------------------------------------------------------------------------------------------------------------------------------------------------------------------------------------------------------------------------------------------------------------------------------------------------------------------------------------------------------------------------------------------------------------------------------------------------------------------------------------+
1 row in set (0.18 sec)
0.18 seconds. That’s… actually good. What about the new one?
mysql> EXPLAIN ANALYZE SELECT Posts.*, Channels.TeamId FROM Posts USE INDEX(idx_posts_create_at_id) LEFT JOIN Channels ON Posts.ChannelId = Channels.Id WHERE (Posts.CreateAt, Posts.Id) > (1557752415221, 'ad
59ire57tfwmjr5r8xqxc75qw') ORDER BY Posts.CreateAt ASC, Posts.Id ASC LIMIT 10000;
+--------------------------------------------------------------------------------------------------------------------------------------------------------------------------------------------------------------------------------------------------------------------------------------------------------------------------------------------------------------------------------------------------------------------------------------------------------------------------------------------------------------------------------------------------------------------------------------------------------------------------------------------------------------------------------------------------------+
| -> Limit: 10000 row(s)  (cost=11119405.48 rows=10000) (actual time=5295.106..5455.285 rows=10000 loops=1)
    -> Nested loop left join  (cost=11119405.48 rows=10000) (actual time=5295.105..5454.572 rows=10000 loops=1)
        -> Filter: ((Posts.CreateAt,Posts.Id) > (1557752415221,'ad59ire57tfwmjr5r8xqxc75qw'))  (cost=221.48 rows=10000) (actual time=5295.078..5388.668 rows=10000 loops=1)
            -> Index scan on Posts using idx_posts_create_at_id  (cost=221.48 rows=10000) (actual time=0.055..5314.753 rows=600000 loops=1)
        -> Single-row index lookup on Channels using PRIMARY (Id=Posts.ChannelId)  (cost=1.00 rows=1) (actual time=0.006..0.006 rows=1 loops=10000)
 |
+--------------------------------------------------------------------------------------------------------------------------------------------------------------------------------------------------------------------------------------------------------------------------------------------------------------------------------------------------------------------------------------------------------------------------------------------------------------------------------------------------------------------------------------------------------------------------------------------------------------------------------------------------------------------------------------------------------+
1 row in set (5.46 sec)
Ah, good, 50 times slower. Uuuugh.
This outcome had no easy escape: I had to split the code flow in two, using the good-looking query when using PostgreSQL, and the original one when using MySQL. And that’s the change that finally got merged. A bit sad, but it is what it is.
What we learned
This was a fun journey after all, and definitely a good optimization: who doesn’t love making something a thousand times faster? It ended up landing on v9.7.0 and later, and got backported to the 9.5 ESR as well, starting in v9.5.3.
Also, I learned a couple of very interesting things:
- Always use
BUFFERSwhen running anEXPLAIN. It gives some data that may be crucial for the investigation. - Always, always try to get an
Index Cond(calledIndex range scanin MySQL) instead of aFilter. - Always, always, always assume PostgreSQL and MySQL will behave differently. Because they do.