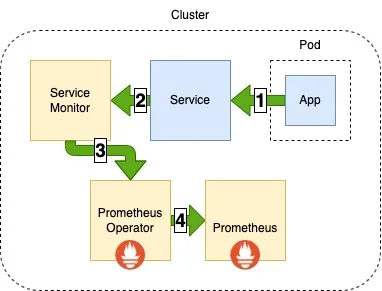
use kubernetes ServiceMonitor to discover services to scrap for prometheus
The idea is to use a kubernetes resource of kind ServiceMonitor so that prometheus knows the endpoint to scrape.
The idea is as follows:
Deploy prometheus
Once you’ve installed prometheus in your kubernetes cluster, e.g. using kube-prometheus helm chart.
Create a src/prometheus/h-values.yml with the following:
---
#
# src: https://github.com/bitnami/charts/tree/main/bitnami/kube-prometheus#parameters
#
prometheus:
  # Add ingress so we can access the prometheus server outside of the cluster.
  ingress:
    enabled: true
    hostname: prometheus.localhost
# Disable tools that are not needed for this demo.
alertmanager:
  enabled: false
blackboxExporter:
  enabled: false
kubeApiServer:
  enabled: false
kubeProxy:
  enabled : false
Then execute the following commands:
helm repo add bitnami https://charts.bitnami.com/bitnami
helm upgrade prometheus bitnami/kube-prometheus --install -f src/prometheus/h-values.yml
Create a ServiceMonitor
You can add the ServiceMonitor to an existing Pod. Create a src/app/servicemonitor.yaml:
apiVersion: monitoring.coreos.com/v1
kind: ServiceMonitor
metadata:
  name: app
  namespace: demo
spec:
  endpoints:
  - interval: 10s
    path: /actuator/prometheus
    targetPort: 9121
Then apply your configuration:
kubectl apply -f src/app/servicemonitor.yamlRelabeling
Relabeling is a powerful tool to dynamically rewrite the label set of a target before it gets scraped. Multiple relabeling steps can be configured per scrape configuration. They are applied to the label set of each target in order of their appearance in the configuration file.
In other words, you can add additional labels to the prometheus metrics, e.g. system_cpu_count{your_custom_label="foobar"}.
Update src/prometheus/h-values.yml:
# Previous properties...

kubelet:
  serviceMonitor:
    cAdvisorRelabelings:
      # List of available prometheus meta labels: https://prometheus.io/docs/prometheus/latest/configuration/configuration/#service
      - sourceLabels: [__meta_kubernetes_service_annotation_Environment]
        targetLabel: Environment
        action: replace
      - sourceLabels: [__meta_kubernetes_service_name]
        targetLabel: Instance
        action: replace
Upgrade your prometheus instance:
helm upgrade prometheus bitnami/kube-prometheus --install -f src/prometheus/h-values.ymlThen update the src/app/servicemonitor.yaml:
spec:
  endpoints:
  - interval: 10s
    path: /actuator/prometheus
    targetPort: 9121
    relabelings:
      # List of available prometheus meta labels: https://prometheus.io/docs/prometheus/latest/configuration/configuration/#pod
      - sourceLabels: [__meta_kubernetes_pod_annotation_Environment]
        targetLabel: Environment
        action: replace
      - sourceLabels: [__meta_kubernetes_pod_container_image]
        targetLabel: image
        action: replace
      - sourceLabels: [__meta_kubernetes_pod_name]
        targetLabel: name
        action: replace
Apply the changes:
kubectl apply -f src/app/servicemonitor.yamlNow, your prometheus metrics will have the additional labels:
system_cpu_count{Environment="demo", container="acquisition", endpoint="9121", image="registry.localhost:5000/iot/swp/acquisition:develop-3", instance="10.42.0.45:9121", name="acquisition-5d5d97c988-qvnwj", namespace="swplocal", pod="acquisition-5d5d97c988-qvnwj", service="acquisition"}